Statistical Approach
The following data is from the Vehicle Rental Services Arrangement. Reporting is updated quarterly and is collected from individual suppliers on the arrangement. Total vehicles are based on the date a vehicle was booked.
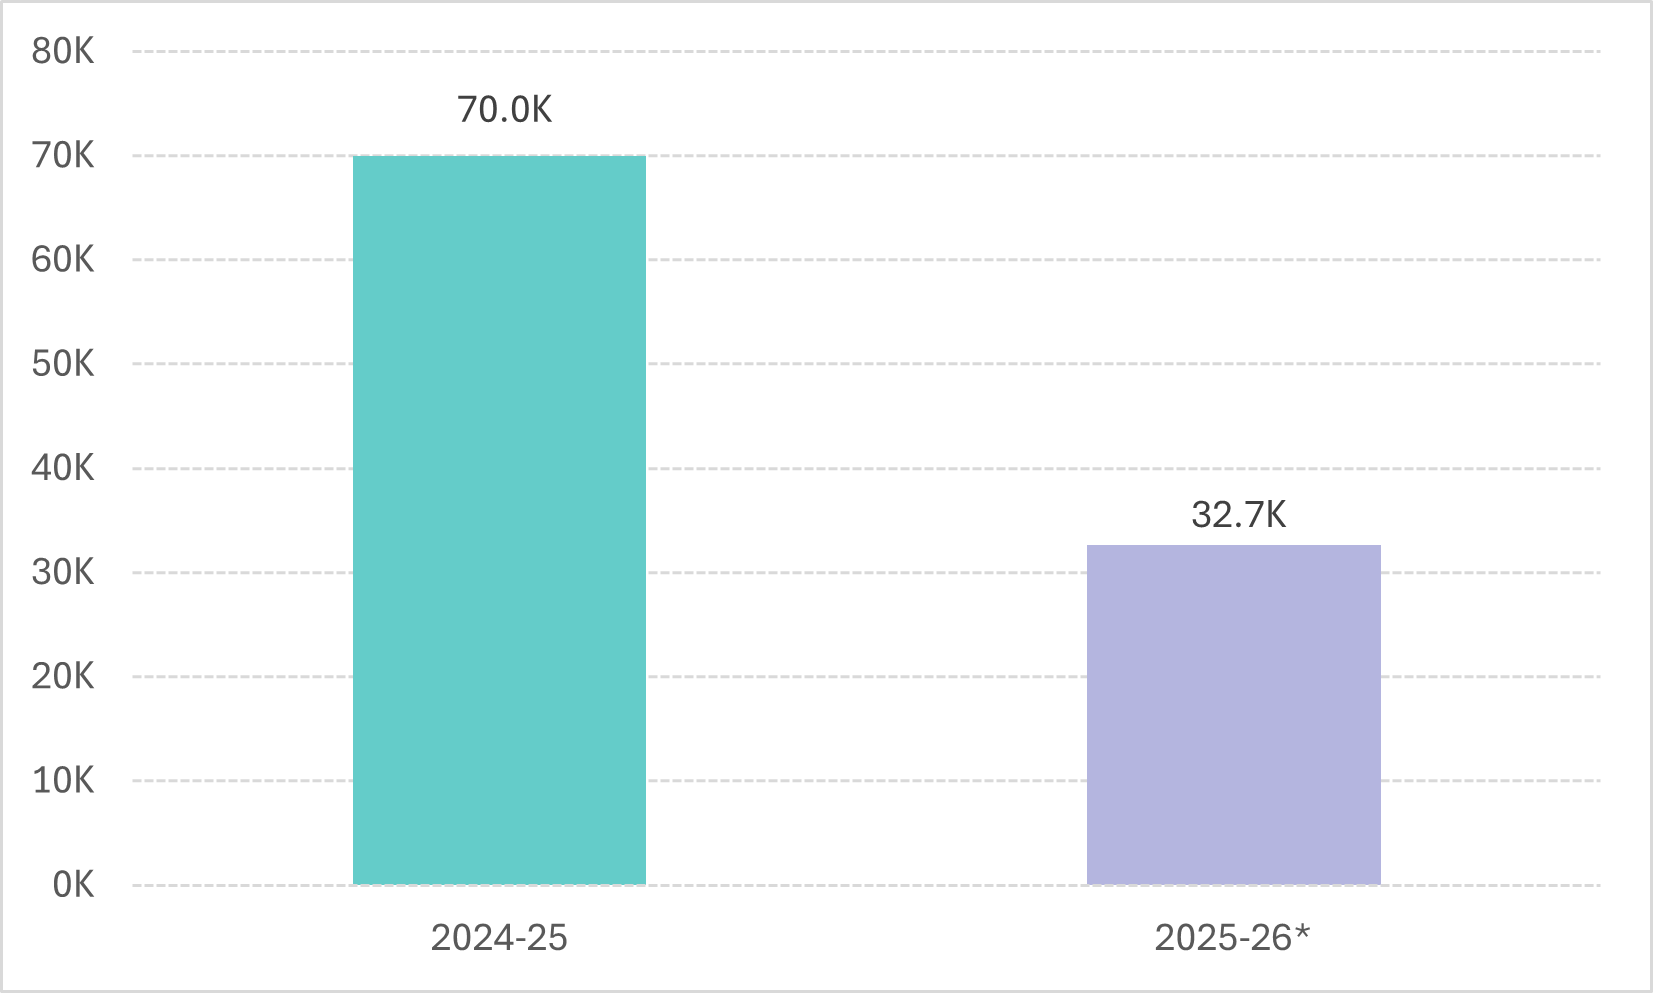
Total Expenditure
From 1 July 2025 to 31 December 2025 the Commonwealth expenditure for Vehicle Rental Services represented $20.8 million across 32.7k vehicle bookings. Of these bookings, 89 percent of bookings by value were made for domestic locations.
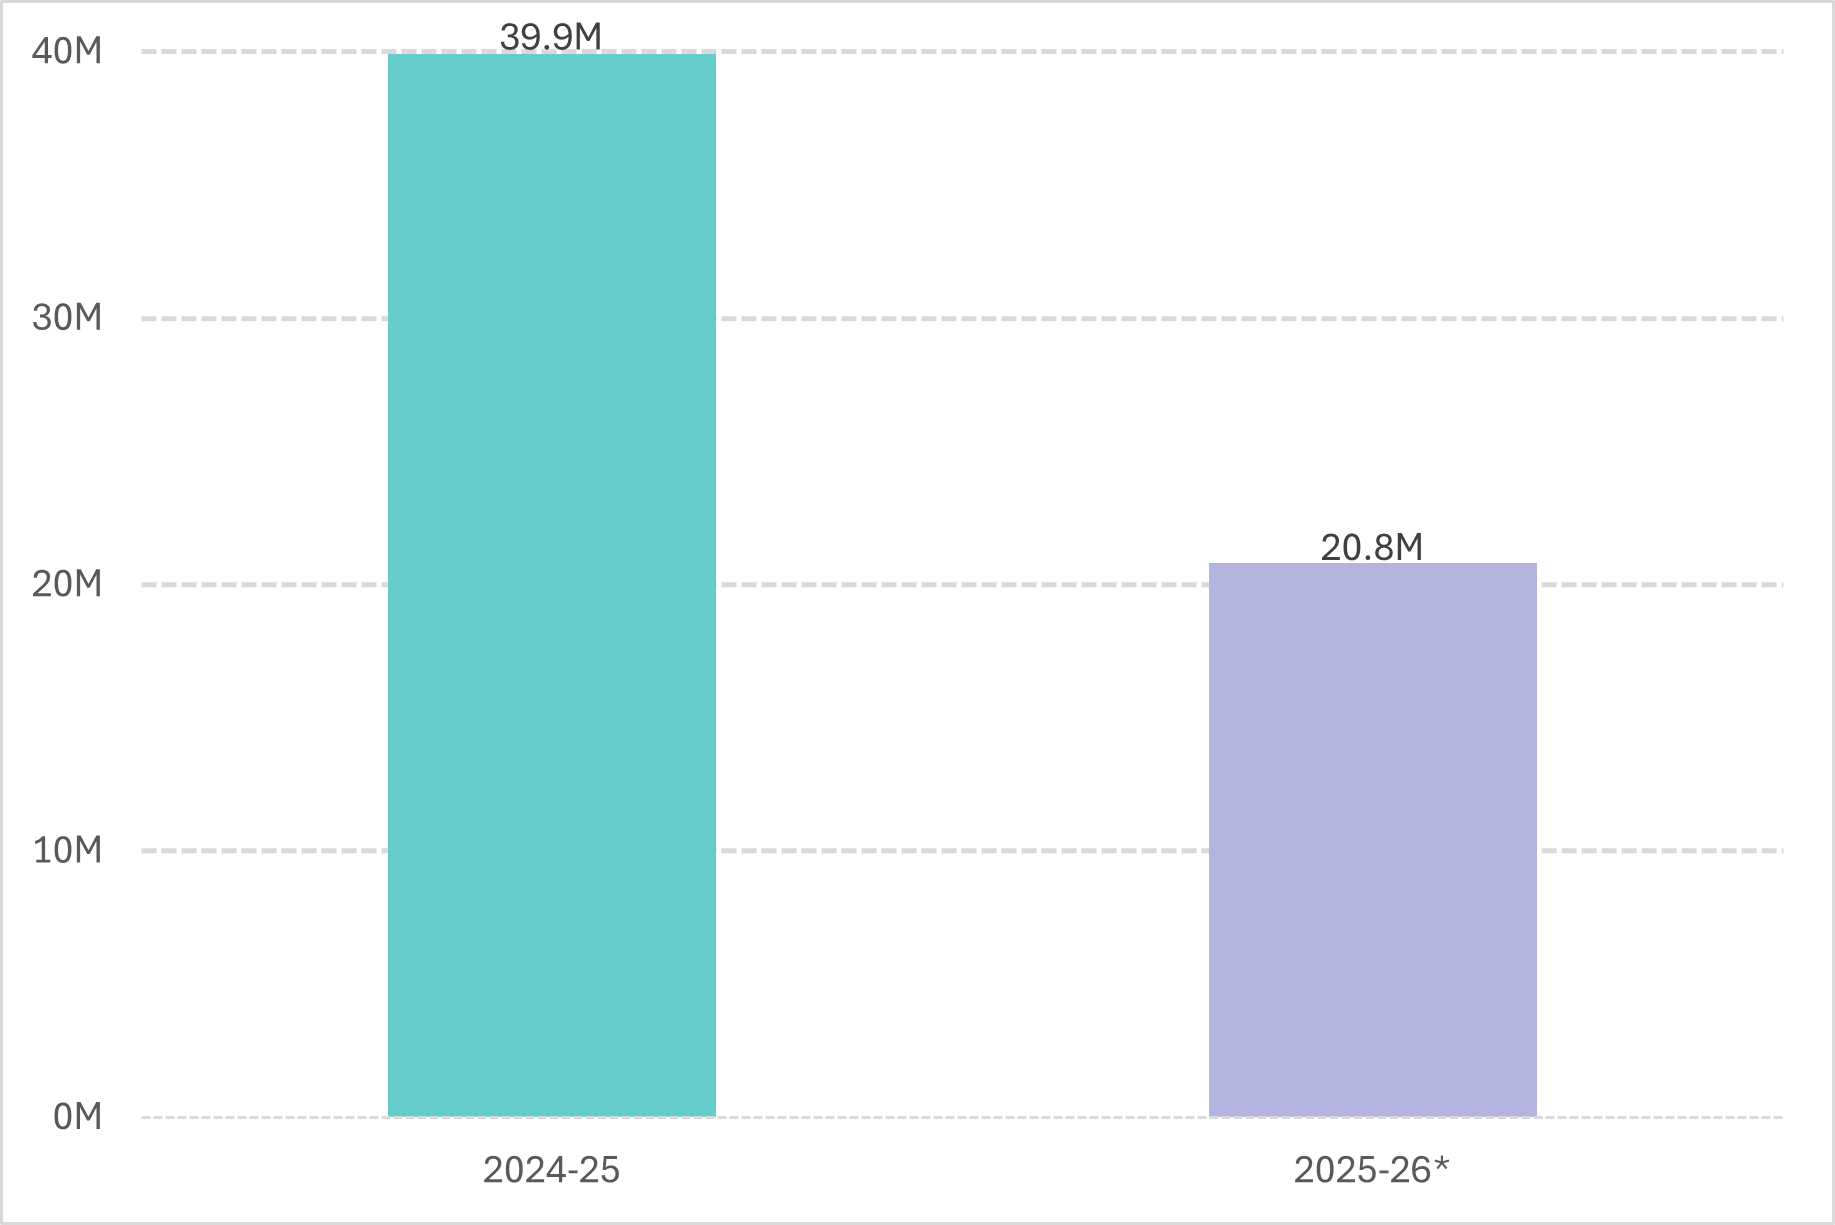
*2025-26 includes data from 1 July 2025 to 31 December 2025
*2025-26 includes data from 1 July 2025 to 31 December 2025
Top Entities
| Entity | Value | Vehicle Rental |
|---|---|---|
| Department of Defence | 16.00m | 23,183 |
| Department of Home Affairs | 1.06m | 1,692 |
| Australian Federal Police | 0.85m | 1,382 |
| Department of Agriculture, Fisheries and Forestry | 0.63m | 1,032 |
| Department of Foreign Affairs and Trade | 0.18m | 438 |
| DCCEEW | 0.15m | 328 |
| Services Australia | 0.15m | 380 |
| Director of National Parks | 0.11m | 191 |
| Bureau of Meteorology | 0.11m | 188 |
| Aged Care Quality and Safety Commission | 0.10m | 395 |
| Murray-Darling Basin Authority | 0.09m | 175 |
| Federal Court of Australia | 0.09m | 100 |
| Australian Bureau of Statistics | 0.08m | 124 |
| Civil Aviation Safety Authority | 0.08m | 236 |
| Department of Infrastructure, Transport, Regional Development, Communications, Sport and the Arts | 0.08m | 180 |
| Department of Industry, Science and Resources | 0.07m | 131 |
| Department of Health, Disability and Ageing | 0.07m | 208 |
| Department of Education | 0.07m | 214 |
| Geoscience Australia | 0.06m | 73 |
| Comcare | 0.06m | 96 |
| Department of Social Services | 0.05m | 93 |
| Australian Electoral Commission | 0.05m | 113 |
| National Disability Insurance Agency | 0.05m | 133 |
| Department of Veterans' Affairs | 0.04m | 146 |
| Australian Nuclear Science and Technology Organisation | 0.04m | 73 |
| Total | 20.32m | 31,304 |
Data includes bookings between 1 July 2025 to 31 December 2025
Top Domestic Locations
| State | Total Value | Total Vehicle Rental |
|---|---|---|
| QLD | $5.03m | 7,985 |
| NT | $2.76m | 2,180 |
| ACT | $2.50m | 6,418 |
| NSW | $2.44m | 4,540 |
| WA | $2.21m | 2,656 |
| SA | $1.68m | 3,351 |
| VIC | $1.44m | 3,560 |
| TAS | $0.27m | 605 |
| Total | $18.32m | 31,294 |
Data includes bookings between 1 July 2025 to 31 December 2025
