AusTender is the Australian Government’s procurement information system. Suppliers and other interested parties seeking information on Australian Government procurements can visit the AusTender website.
The Commonwealth Procurement Rules (CPRs) require non-corporate Commonwealth entities (NCEs) and prescribed corporate Commonwealth entities (CCEs) to publish a range of information on AusTender, including planned procurements, open requests for tender, standing offer arrangements and details of contracts that have been awarded. NCEs report details of contracts with a value of $10,000 or more, and prescribed CCEs report contracts with a value of $400,000 or more or $7.5 million or more for construction services. NCEs and prescribed CCEs are also required to report previously unreported contracts that are amended to be at or above the relevant threshold, where there is an increase or decrease in contract value of $10,000 or more, or where accumulated unreported amendments will vary the reported contract value by $10,000 or more. Under the devolved procurement framework, individual entities are responsible for accurately reporting their procurements and contracts on AusTender.
The following data reflects contractual information reported on AusTender by entities during the relevant financial year in accordance with entities' procurement publishing obligations. Data is extracted from AusTender at the end of each financial year to prepare the aggregated information on this page. The figures for financial year 2024-25 were extracted from AusTender on 13 August 2025 to allow for the 42-day contract reporting window. Contract data can be amended, varied and updated by entities over time.
Note: To view current AusTender data, visit Information Made Easy (tenders.gov.au).
Changes to reporting from 1 July 2024
Care should be taken when comparing 2024–25 results with earlier years because what is published in AusTender changed in 2024–25.
On 1 July 2024, the Department of Finance updated AusTender so entities can publish negative amendments—updates to a previously reported contract that reduce the reported value (for example, a scope reduction or a correction to a lower amount). As such, values provided in these statistics are aggregates of new contract and amendment amounts and any reductions, unless otherwise indicated.
Because these value reducing updates were not published in prior years, totals and year on year movements for 2024–25 may not be directly comparable with earlier years.
Total Procurement Contracts
The contract values on AusTender represent the total maximum value of each contract over its life, including where contracts span multiple years. AusTender data does not reflect annual expenditure.
Total Value of Procurement Contracts by Financial Year
Procurement Thresholds
Below is a summary of the number and value of contracts awarded at various thresholds.
| New Contract Activity by Value Threshold | ||||
|---|---|---|---|---|
| Threshold | Value | % Value | Volume | % Volume |
| Below $80k | $1.1b | 2.2% | 34,537 | 59.0% |
| $80k to < $200k | $1.1b | 2.3% | 8,700 | 14.9% |
| $200k to < $1m | $4.9b | 10.2% | 11,693 | 20.0% |
| $1m to < $4m | $4.8b | 9.9% | 2,443 | 4.2% |
| $4m to < $7.5m | $2.7b | 5.7% | 511 | 0.9% |
| $7.5m to < $20m | $4.4b | 9.2% | 374 | 0.6% |
| $20m and Above | $29.1b | 60.5% | 288 | 0.5% |
| Total Net | $48.0b | 100.0% | 58,546 | 100.0% |
Location of suppliers
93.8 per cent by volume and 88.3 per cent by value of the contracts in 2024-25 were awarded to businesses with an Australian address.
| Total | Overseas | |
|---|---|---|
| Value $million | $104,899.8 | $12,300.8 |
| % | 100.0% | 11.7% |
| Number | 86,926 | 5,408 |
| % | 100.0% | 6.2% |
Goods & Services
| Total | Goods | Services | ||
|---|---|---|---|---|
| 2024-25 | Value $million | 104,899.8 | 26,980.6 | 77,919.2 |
| % | 100% | 25.7% | 74.3% | |
| Number | 86,926 | 23,879 | 63,047 | |
| % | 100% | 27.5% | 72.5% | |
| 2023-24 | Value $million | 99,641.1 | 47,482.9 | 52,158.3 |
| % | 100% | 47.65% | 52.35% | |
| Number | 83,453 | 23,999 | 59,454 | |
| % | 100% | 28.76% | 71.24% | |
| 2022-23 | Value $million | 74,824.4 | 27,329.6 | 47,494.8 |
| % | 100% | 36.53% | 63.47% | |
| Number | 83,625 | 22,849 | 60,776 | |
| % | 100% | 27.32% | 72.68% | |
| 2021-22 | Value $million | 80,793.4 | 31,495.0 | 49,298.4 |
| % | 100% | 38.98% | 61.02% | |
| Number | 92,303 | 23,859 | 68,444 | |
| % | 100% | 25.85% | 74.15% | |
| 2020-21 | Value $million | 69,794.5 | 25,692.5 | 44,102.0 |
| % | 100% | 37% | 63% | |
| Number | 84,054 | 24,119 | 59,935 | |
| % | 100% | 29% | 71% | |
| 2019-20 | Value $million | 53,975.4 | 20,582.0 | 33,393.3 |
| % | 100% | 38% | 62% | |
| Number | 81,174 | 24,559 | 56,615 | |
| % | 100% | 30% | 70% | |
| 2018-19 | Value $million | 64,454.6 | 25,496.0 | 38,958.6 |
| % | 100% | 40% | 60% | |
| Number | 78,150 | 22,706 | 55,444 | |
| % | 100% | 29% | 71% | |
| 2017-18 | Value $million | 71,127.3 | 39,346.1 | 31,781.2 |
| % | 100% | 55% | 45% | |
| Number | 73,458 | 23,092 | 50,366 | |
| % | 100% | 31% | 69% | |
| 2016-17 | Value $million | 47,354.7 | 20,417.8 | 26,936.9 |
| % | 100% | 43% | 57% | |
| Number | 64,092 | 22,593 | 41,499 | |
| % | 100% | 35% | 65% |
| Category Titles | Value $million | % of Total Value |
|---|---|---|
| Professional engineering services | 14,249.5 | 13.6% |
| Building construction and support and maintenance and repair services | 10,397.1 | 9.9% |
| Conventional war weapons | 6,473.4 | 6.2% |
| Military services and national defence | 6,280.6 | 6.0% |
| Comprehensive health services | 5,371.8 | 5.1% |
| Computer services | 4,525.4 | 4.3% |
| Management support services | 4,286.6 | 4.1% |
| Employment services | 2,942.6 | 2.8% |
| Temporary personnel services | 2,334.9 | 2.2% |
| Marine craft systems and subassemblies | 1,903.5 | 1.8% |
| Military fixed wing aircraft | 1,769.5 | 1.7% |
| Travel facilitation | 1,717.5 | 1.6% |
| Management advisory services | 1,716.3 | 1.6% |
| Individual health screening and assessment services | 1,689.8 | 1.6% |
| Education and Training Services | 1,657.7 | 1.6% |
| Lease and rental of property or building | 1,491.2 | 1.4% |
| Missiles | 1,474.8 | 1.4% |
| Components for information technology or broadcasting or telecommunications | 1,387.0 | 1.3% |
| Communications Devices and Accessories | 1,335.9 | 1.3% |
| Software | 1,305.5 | 1.2% |
Note: Contracts reported on AusTender are categorised under the United Nations Standard Products and Services Code (UNSPSC).
Contracts by Commonwealth Entity
| RANK | ||||||
|---|---|---|---|---|---|---|
| Top Entity | Value $million | % of total Value | 2024-25 | 2023-24 | 2022-23 | 2021-22 |
| Department of Defence | 58,805.7 | 56.06% | 1 | 1 | 1 | 1 |
| Department of Home Affairs | 6,260.7 | 5.97% | 2 | 5 | 4 | 2 |
| Department of Health, Disability and Ageing | 5,479.8 | 5.22% | 3* | 2 | 3 | 4 |
| Department of Employment and Workplace Relations | 3,901.5 | 3.72% | 4 | 11 | 2 | 3 |
| Services Australia | 2,659.0 | 2.53% | 5 | 4 | 6 | 5 |
| Department of Veterans' Affairs | 2,623.0 | 2.50% | 6 | 16 | 23 | 16 |
| National Blood Authority | 2,544.2 | 2.43% | 7 | 59 | 18 | 32 |
| Department of Foreign Affairs and Trade - Australian Aid Program | 2,028.0 | 1.93% | 8 | 7 | 7 | 7 |
| Department of Foreign Affairs and Trade | 1,940.6 | 1.85% | 9 | 8 | 9 | 15 |
| Australian Taxation Office | 1,899.0 | 1.81% | 10 | 3 | 5 | 6 |
*The formation of new entities following Machinery of Government changes means they can’t be compared to entities of previous financial years.
| Total Value $million | % of Total Value | |
|---|---|---|
| Total of top 10 entities | 88,141.4 | 84.0% |
| Total of other entities | 16,758.4 | 16.0% |
| Grand total of all entities | 104,899.8 | 100% |
*AusTender Data as at 13 August 2025.
Estimates of Small and Medium Enterprise (SME) Participation
Policy changes to support SMEs
The Commonwealth Procurement Framework is non-discriminatory and requires that all potential suppliers are treated equitably based on their commercial, legal, technical and financial abilities and that they are not discriminated against, for example, due to their size.
Thresholds:
The Commonwealth has a commitment to support SMEs through two targets. In 2024-25 those targets were:
- Non-corporate Commonwealth entities procuring 25 per cent of contracts by value from SMEs; for contracts with a value of up to $1 billion; and
- Non-corporate Commonwealth entities procuring 40 per cent of contracts by value from SMEs, for contract with a value of up to $20 million.
Definition:
For the period 2023-24 the definition of an SME was an Australian or New Zealand firm with fewer than 200 full-time equivalent employees. A small business is defined as a business with fewer than 20 full-time equivalent employees.
From 1 July 2024, the Commonwealth applied a new definition for Small and Medium sized enterprises. When assessing the number of employees a firm has, employees of any associated entity to the firm are included. Associated entities to a firm include a firm’s parent company, a firm’s subsidiaries, and any related bodies corporate to the firm.
This update ensures that Commonwealth work that is intended for SMEs goes to organisations that are genuinely small or medium.
Economic Benefits:
The CPRs require the economic benefit to the Australian economy to be considered as part of the value for money assessment for procurements. In 2024-25, these captured procurements valued above $1 million for non-construction services and $7.5 million for construction services, where an Appendix A exemption did not apply or where a standing offer was not used.
Appendix A Exemptions:
The Commonwealth Procurement Rules include an Appendix A exemption (17) which allows a limited tender approach for the procurement of goods and services from an SME. In 2024-25 this policy applied to procurements with a value of $500,000 or less.
The Commonwealth Procurement Rules include an Appendix A exemption (16) which allows a limited tender approach to procure goods and services from an SME with at least 50 per cent Aboriginal or Torres Strait Islander ownership.
Procurement Connected Policies:
The Indigenous Procurement Policy is a mandatory procurement-connected policy that includes specific targets for agencies to contract with indigenous businesses, most of which are SMEs.
Australian Industry Participation (AIP) is a mandatory procurement connected policy that encourages full, fair and reasonable opportunity for Australian businesses to compete for work in major public and private projects in Australia.
Finance Whole of Government Panel Policies:
The Department of Finance owns and manages the Management Advisory Services and People Panel arrangements. Concurrent with the changes to the CPRs both arrangements were updated to:
- Mandate that entities must include at least one SME in every approach to the panel; and
- Provides a new 5% flexibility allowance for entities to directly engage First Nations businesses that are not on the panel.
Statistical Estimate of Small and Medium Enterprise (SME) Participation in 2024-25
Statistical Approach:
The SME Statistics estimate the level of SME participation in Government procurement. The estimate is provided by the Australian Bureau of Statistics (ABS) based on AusTender data and the ABS Business Register.
Business Participation Summary
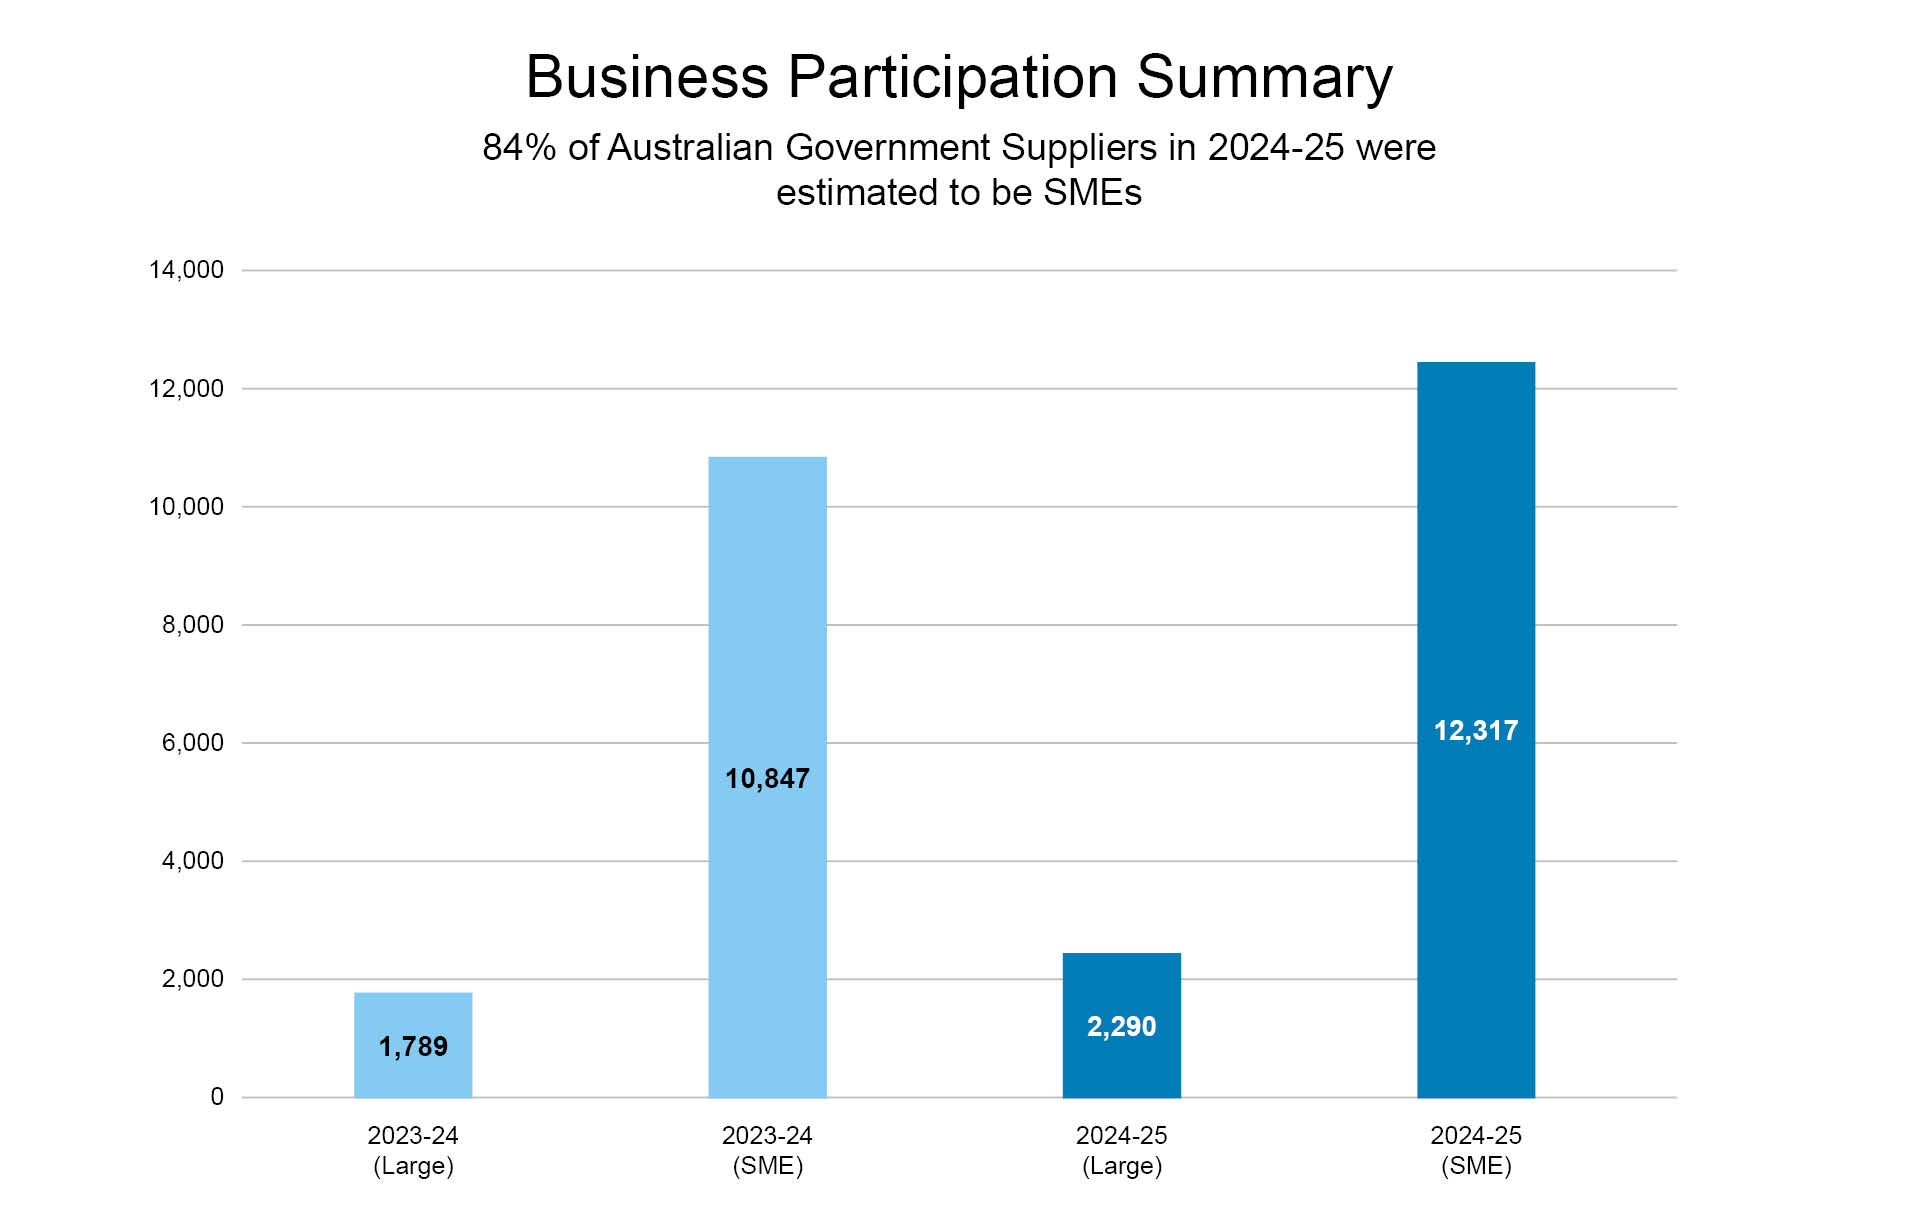
*AusTender Data as at 13 August 2025.
In 2024-25, the Commonwealth contracted with 1,470 more SMEs than the prior year and 1,712 more SMEs than in 2022-23.
Impact of High Procuring Activities
In 2024-25, the Commonwealth awarded $104.9 billion to all suppliers - the highest ever value reported on AusTender. For new contracts in 2024-25, 60.5% ($29.1 billion) were over $20 million, and 9.5% ($4.6 billion) were over $1 billion.
The SME target was amended from 1 July 2024 to remove the distorting effect of high value procurements, to exclude contracts valued at or above $1 billion. Target one, Non-corporate Commonwealth entities procuring 20 per cent of contracts, by value from SMEs was removed and replaced with a new target of 25 per cent, for contracts up to $1 billion.
Impact of COVID-19 on procurement activity
In response to the COVID-19 pandemic, the Australian Government undertook a range of targeted procurement activities in 2020-21 and 2021-22 with a large proportion of this activity being delivered through SMEs. Comparisons between 2024-25, 2023-24 and both 2020-21 and 2021-22 should be made carefully, mindful of this impact.
Estimated Commonwealth Volume of SME Contracts
The Commonwealth awarded 45,556 contracts to SMEs representing 52.4 per cent of contract volume. This was an increase of 1,914 over 2023-24, and 3,756 compared to 2019-20.
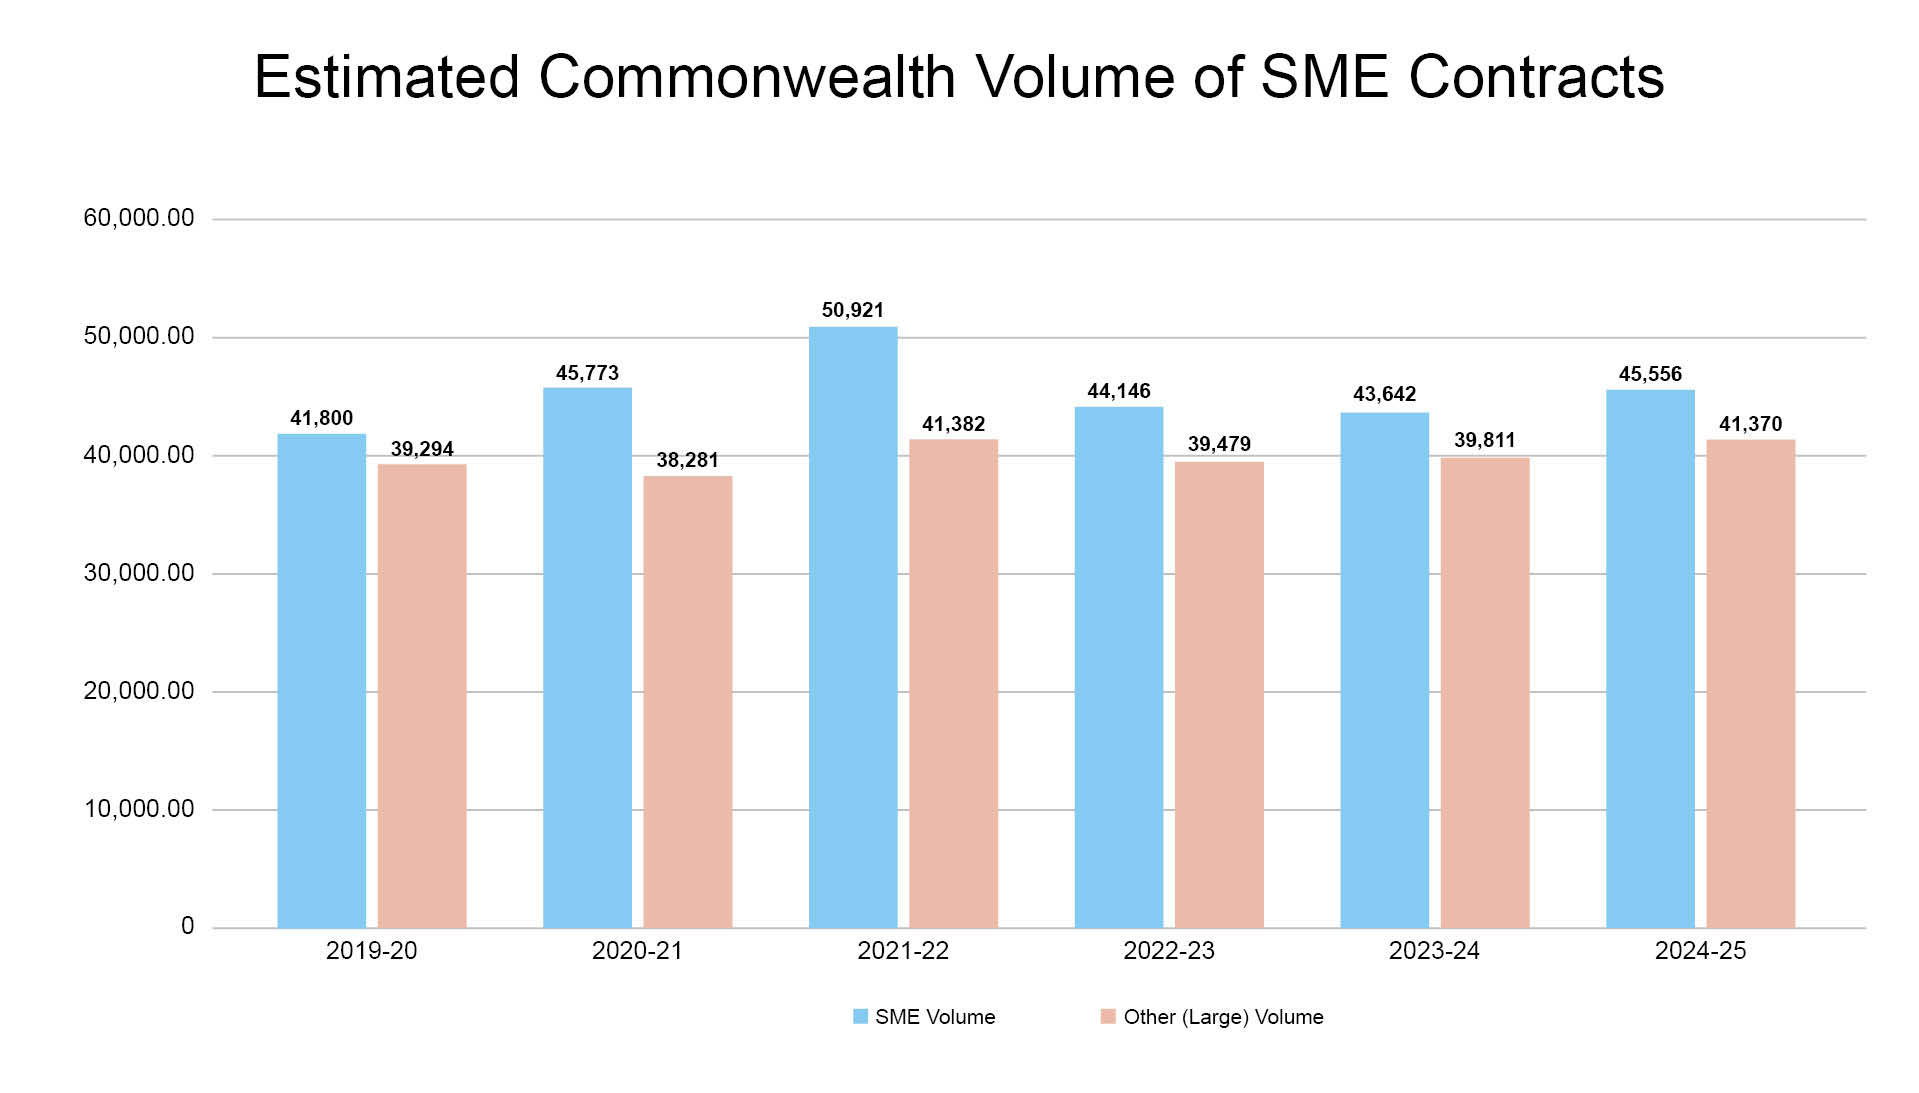
*AusTender Data as at 13 August 2025.
Estimated Commonwealth Value of SME Contracts
(Below $1 billion)
From 1 July 2024, the SME targets exclude contracts valued at or above $1 billion. This enables better comparison of SME figures and removes volatility from the reporting.
In 2024-25, 20.7 per cent of contracts by value (below $1 billion) were awarded to SMEs with a combined value of $14.7 billion, increasing by $1.1 billion from 2019-20.
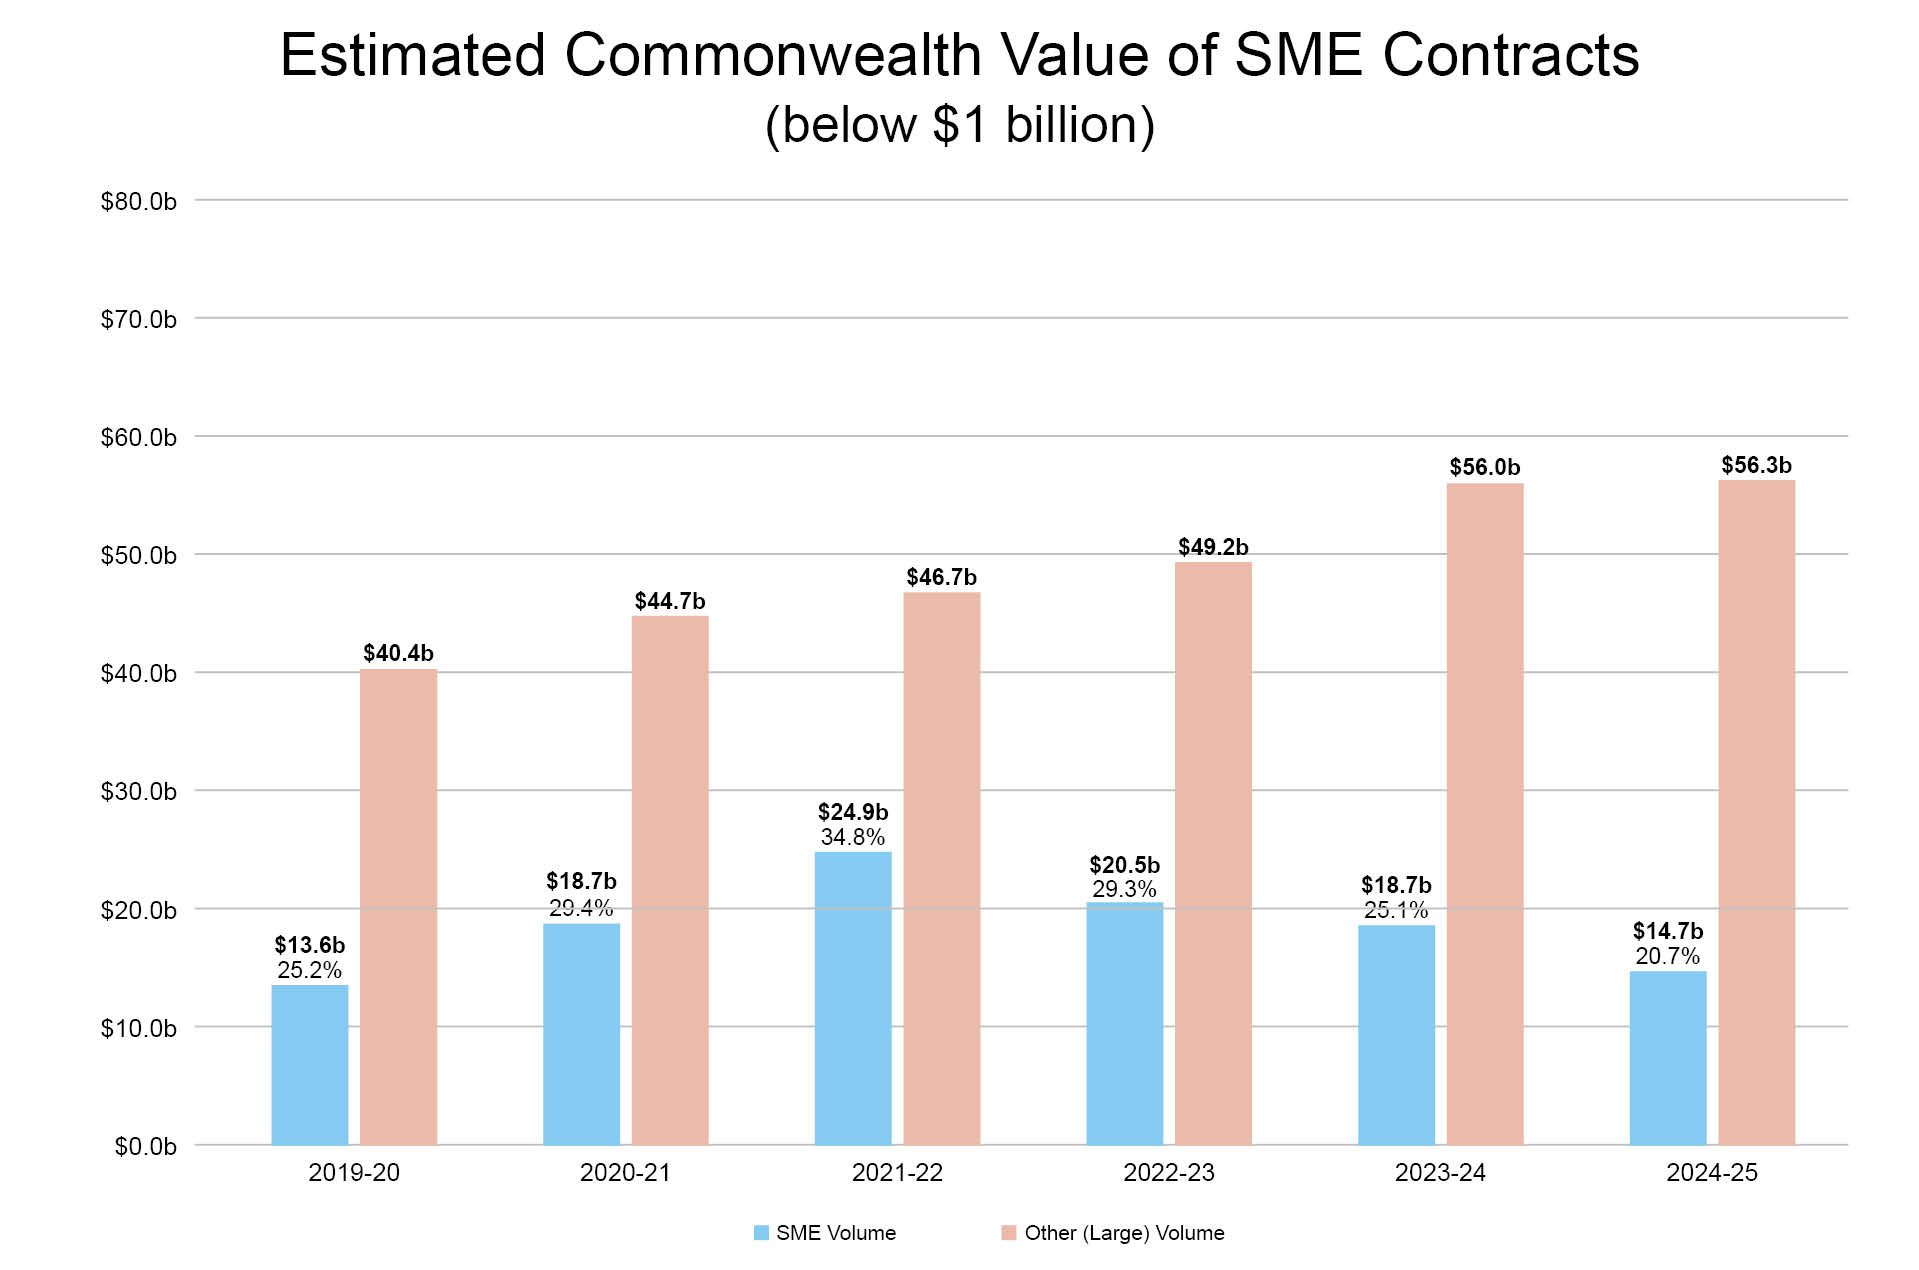
*Note – Amendments to report contract value reductions were introduced from FY2024-25. Care should be taken when comparing data between different financial years.
Estimated Commonwealth Value of SME Contracts
(Below $20 million)
The proportion by value of SME procurements for contracts below $20 million increased from 40.8 per cent in 2022-23 and 40.3 per cent in 2023-24 to 51.9 per cent in 2024-25.
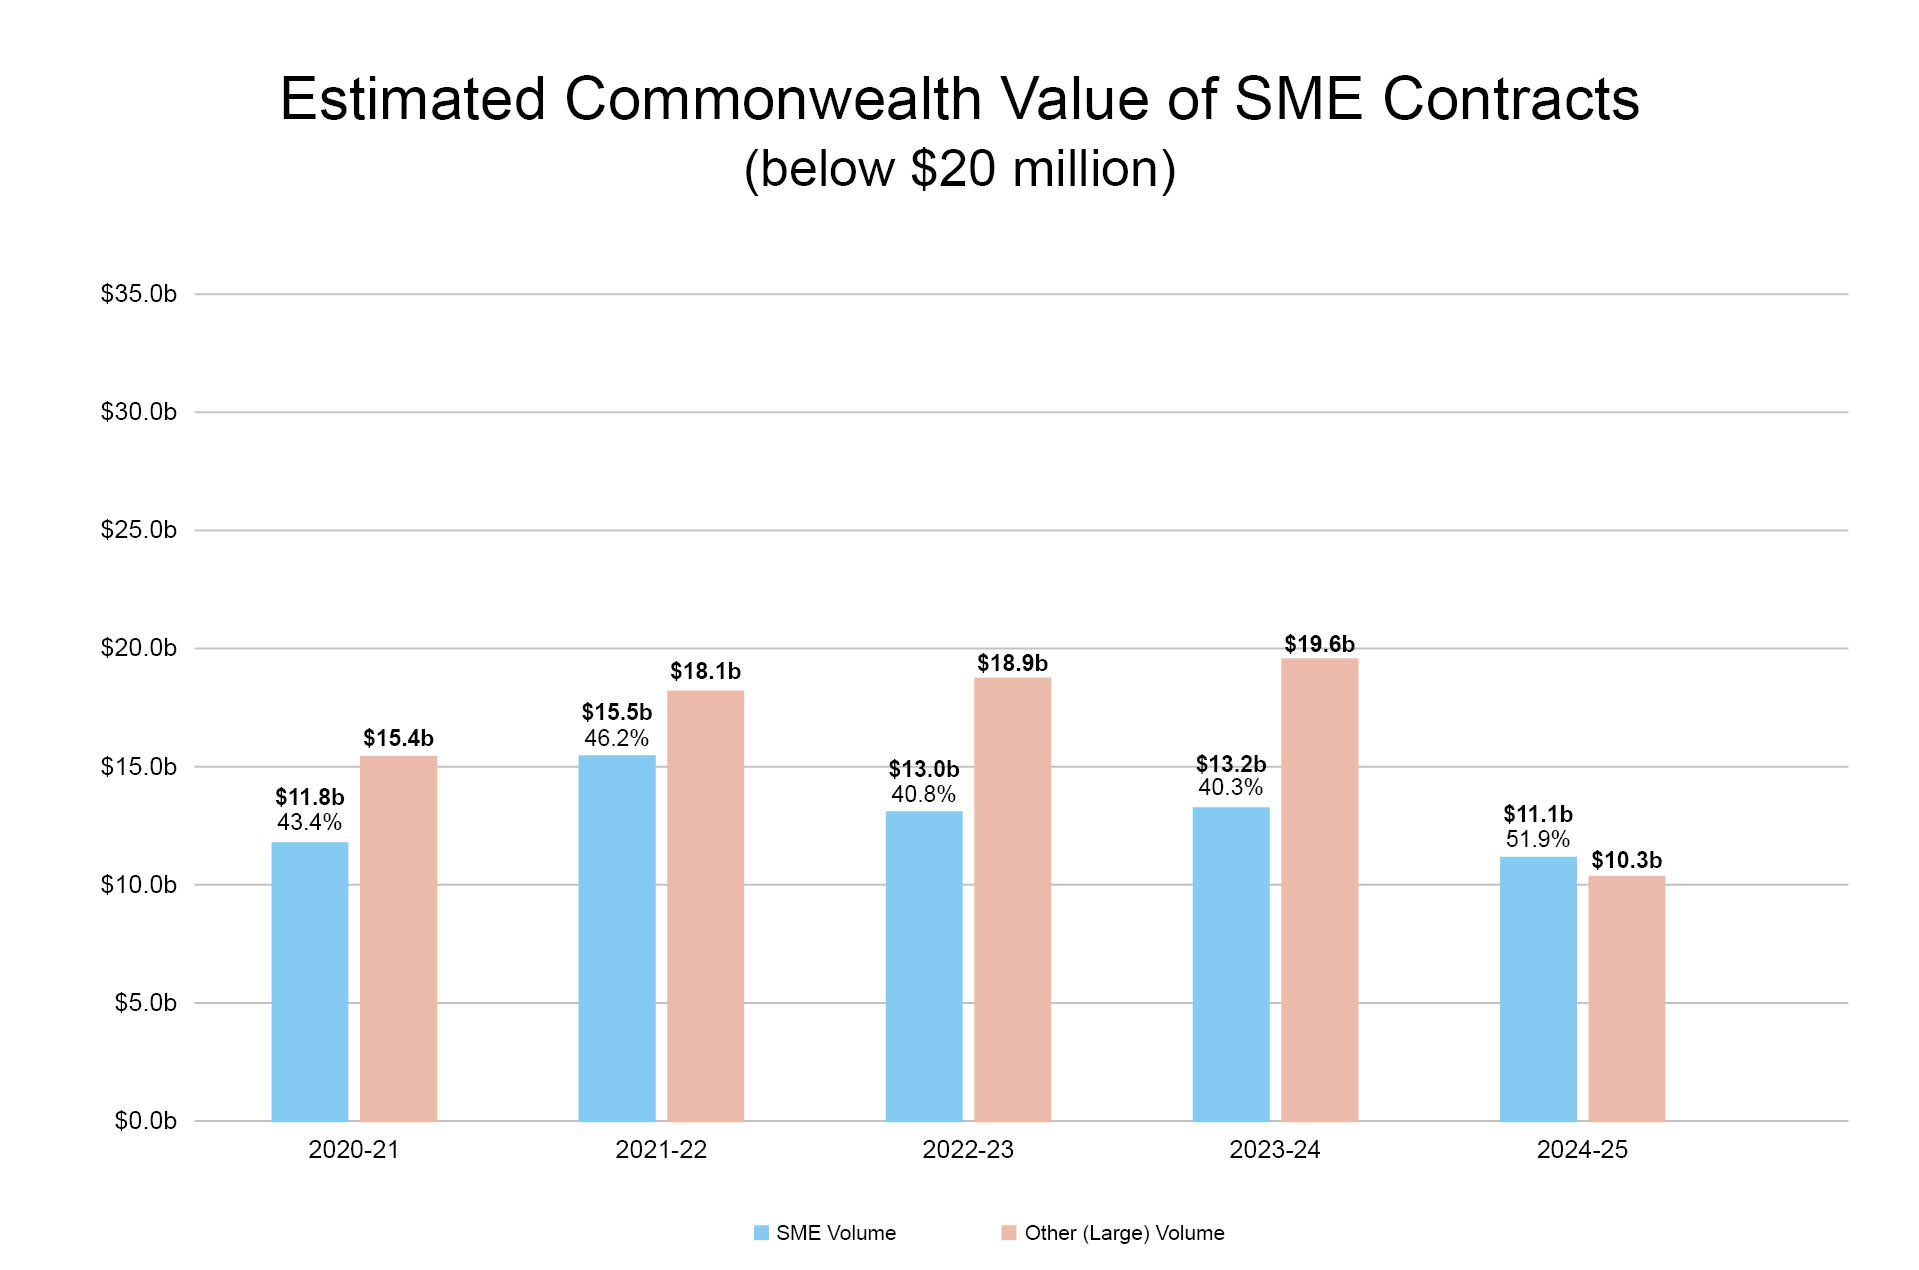
*Note – Amendments to report contract value reductions were introduced from FY2024-25. Care should be taken when comparing data between different financial years.
Estimated Commonwealth Value of SME Contracts
(All contracts)
The following chart sets out the estimated value of SME contracts including Department of Defence contracts.
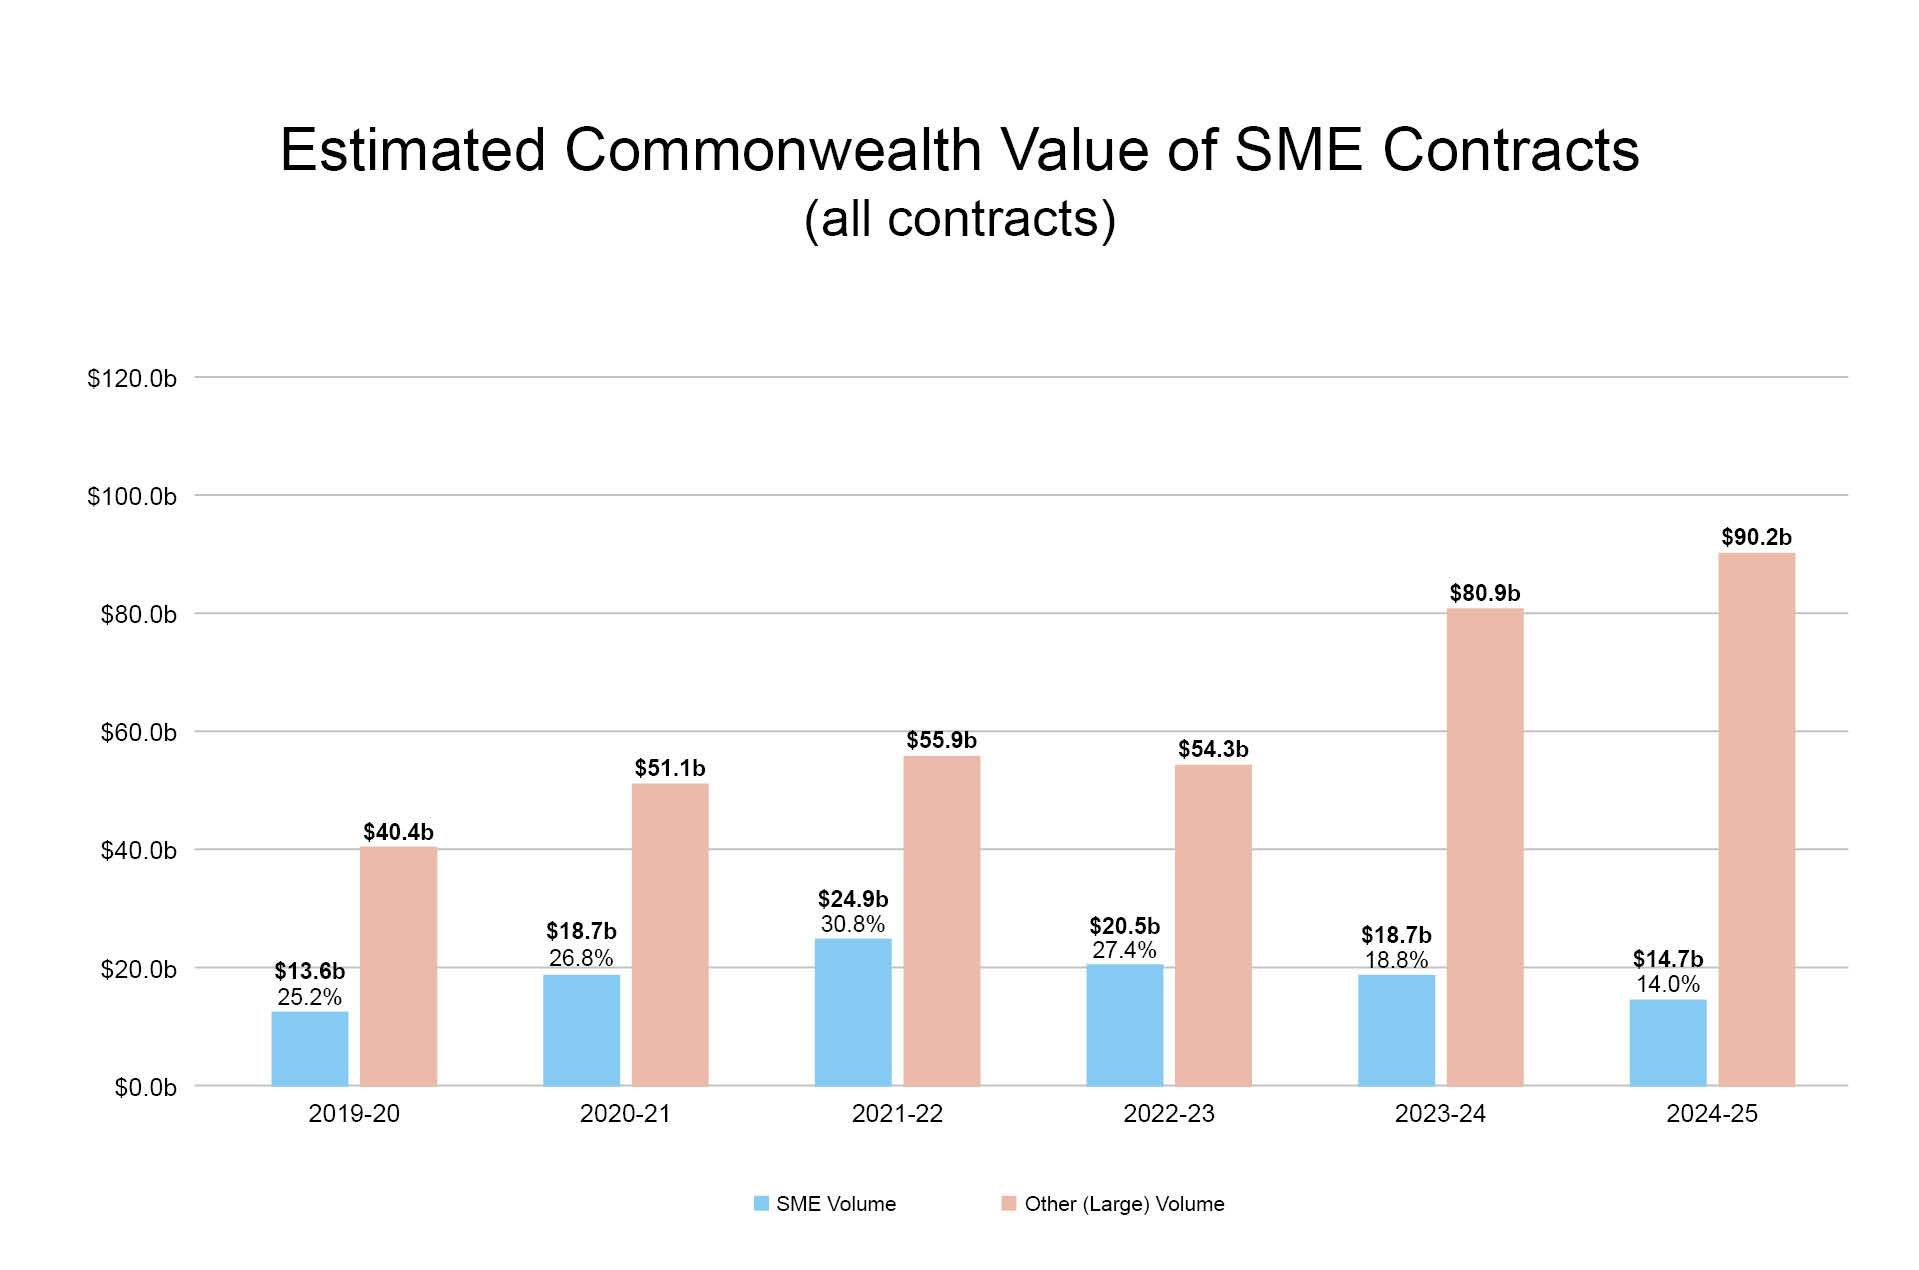
*Note – Amendments to report contract value reductions were introduced from FY2024-25. Care should be taken when comparing data between different financial years.
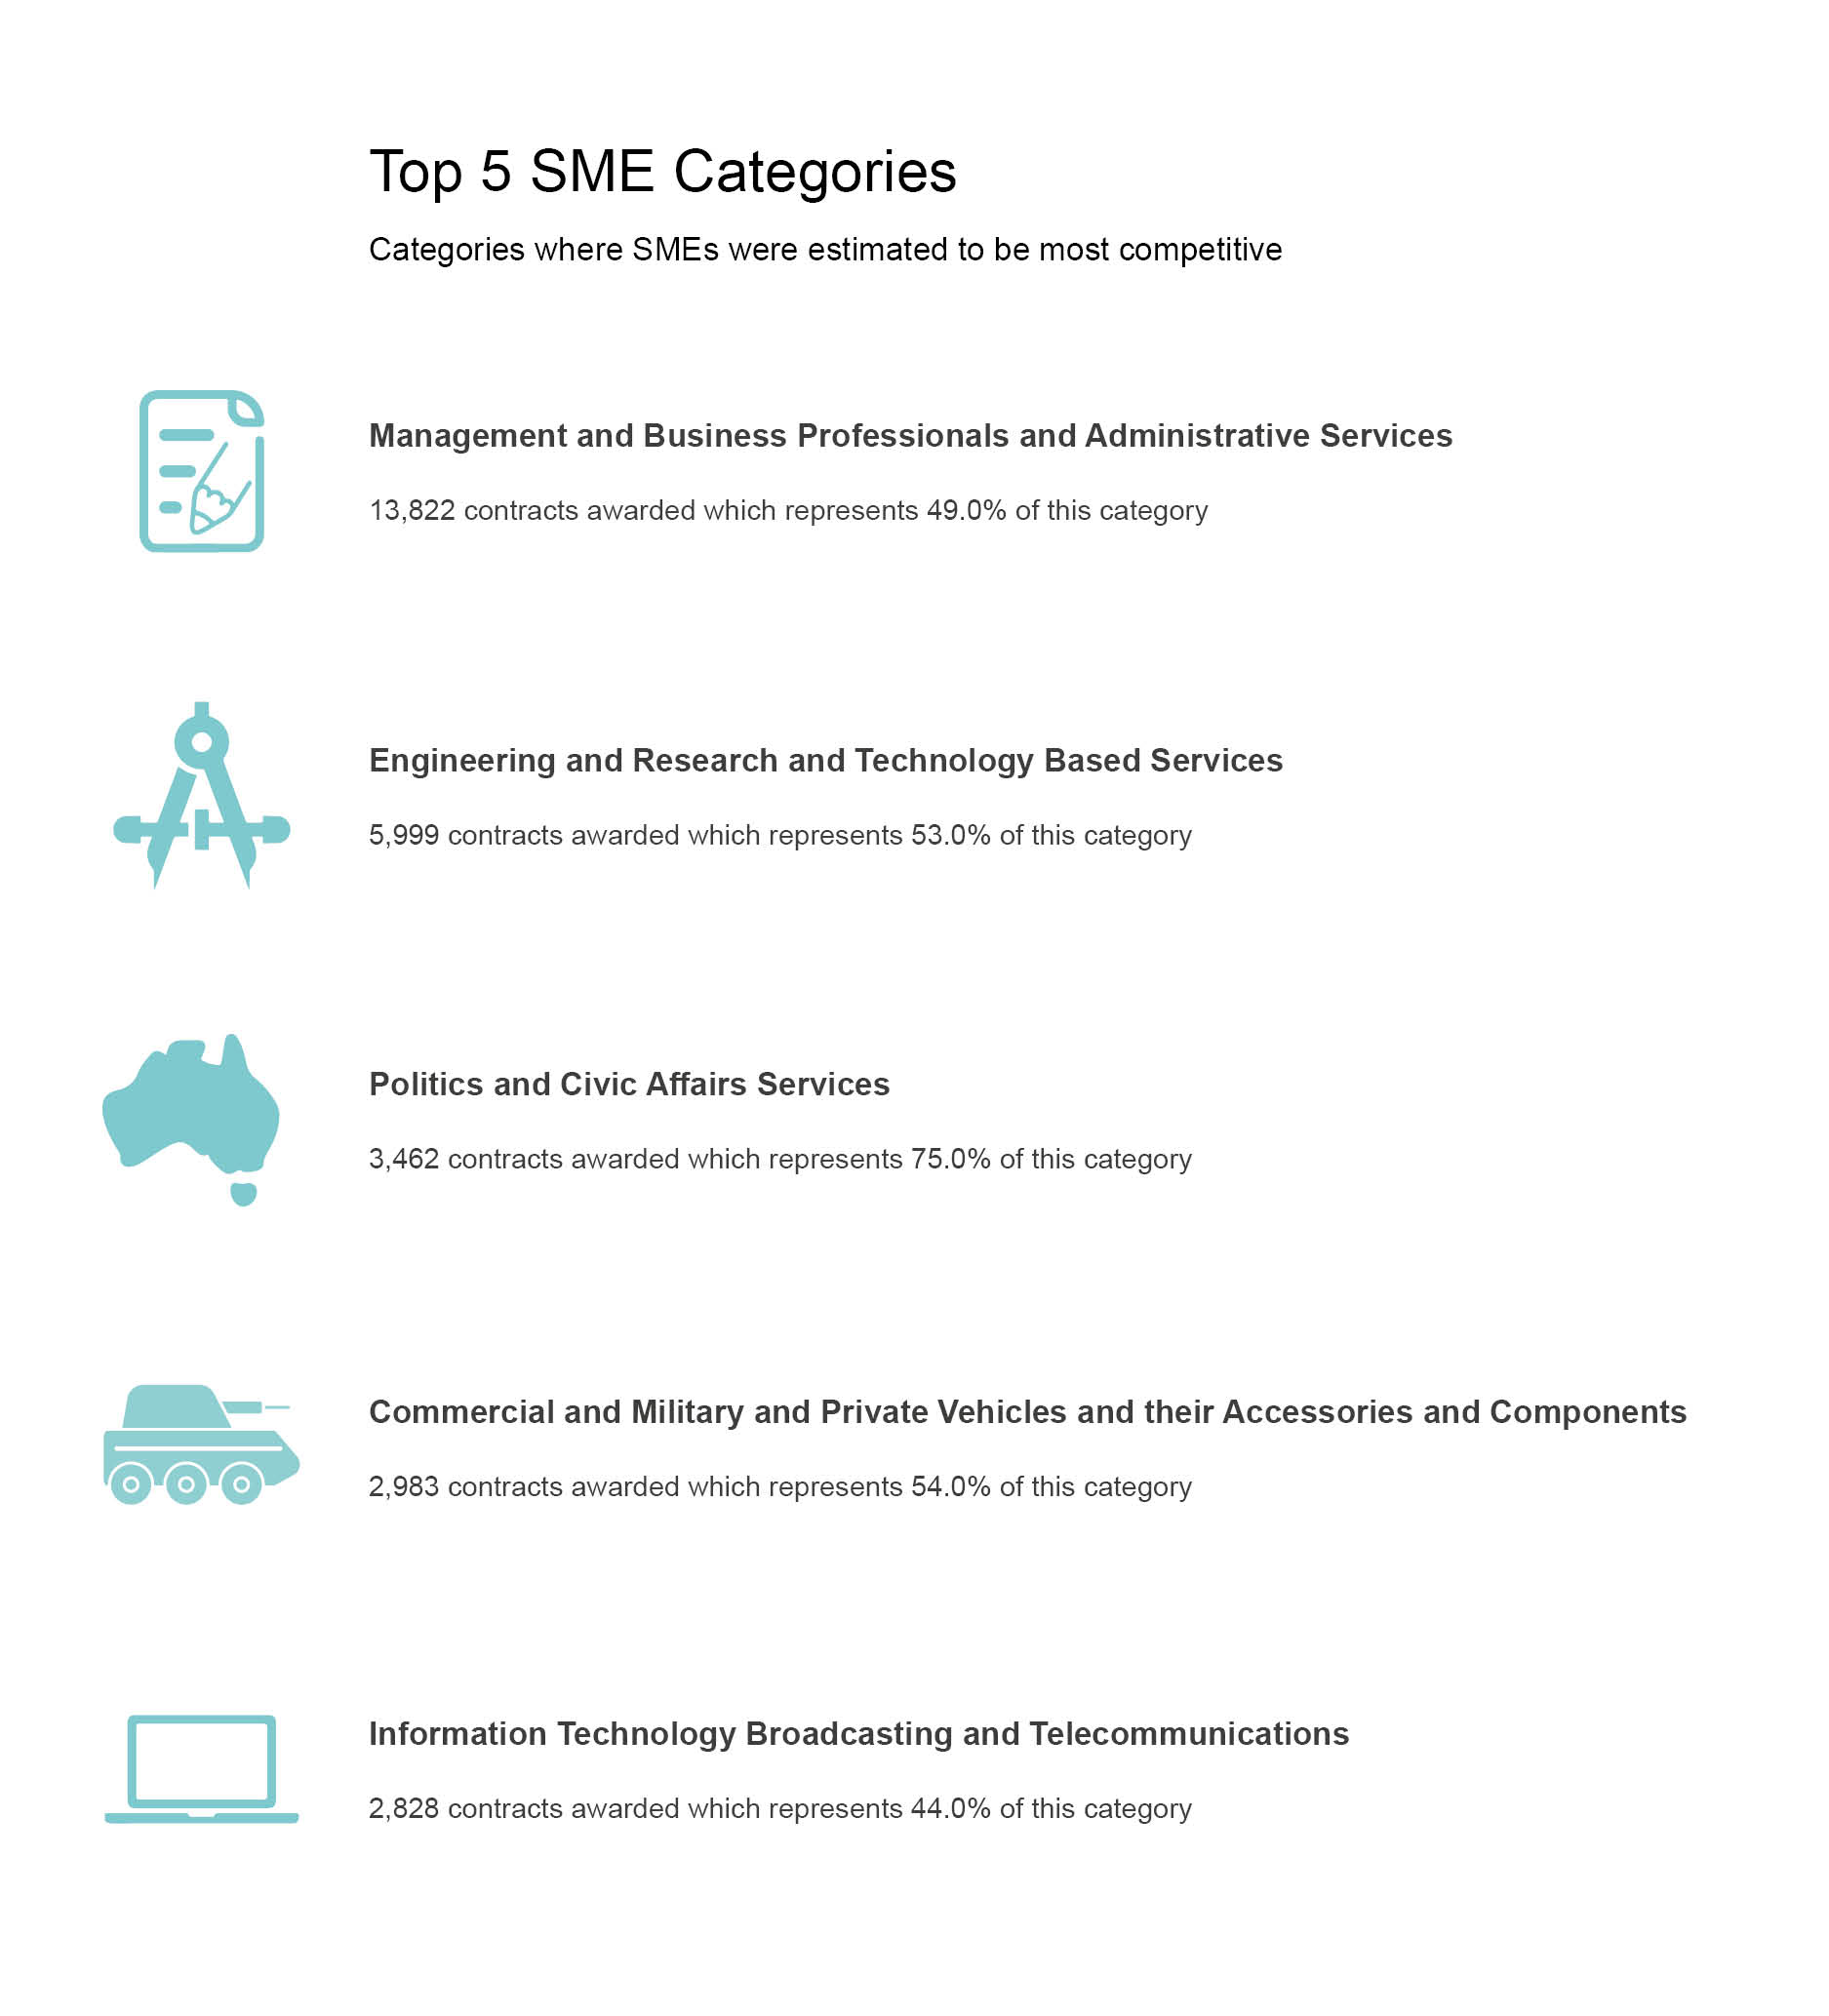
Top 5 SME categories
In 2024-25 the UNSPSC categories where SMEs were estimated to be most competitive were:
| Category | Contracts awarded to SMEs | SME proportion (volume) of category | Value ($m) |
|---|---|---|---|
| Management and Business Professionals and Administrative Services | 13,822 | 49% | $4,200.30 |
| Engineering and Research and Technology Based Services | 5,999 | 53% | $2,213.90 |
| Politics and Civic Affairs Services | 3,462 | 75% | $838.30 |
| Commercial and Military and Private Vehicles and their Accessories and Components | 2,983 | 54% | $543.90 |
| Information Technology Broadcasting and Telecommunications | 2,828 | 44% | $989.20 |
Estimated Value of SME Contracts by Portfolio
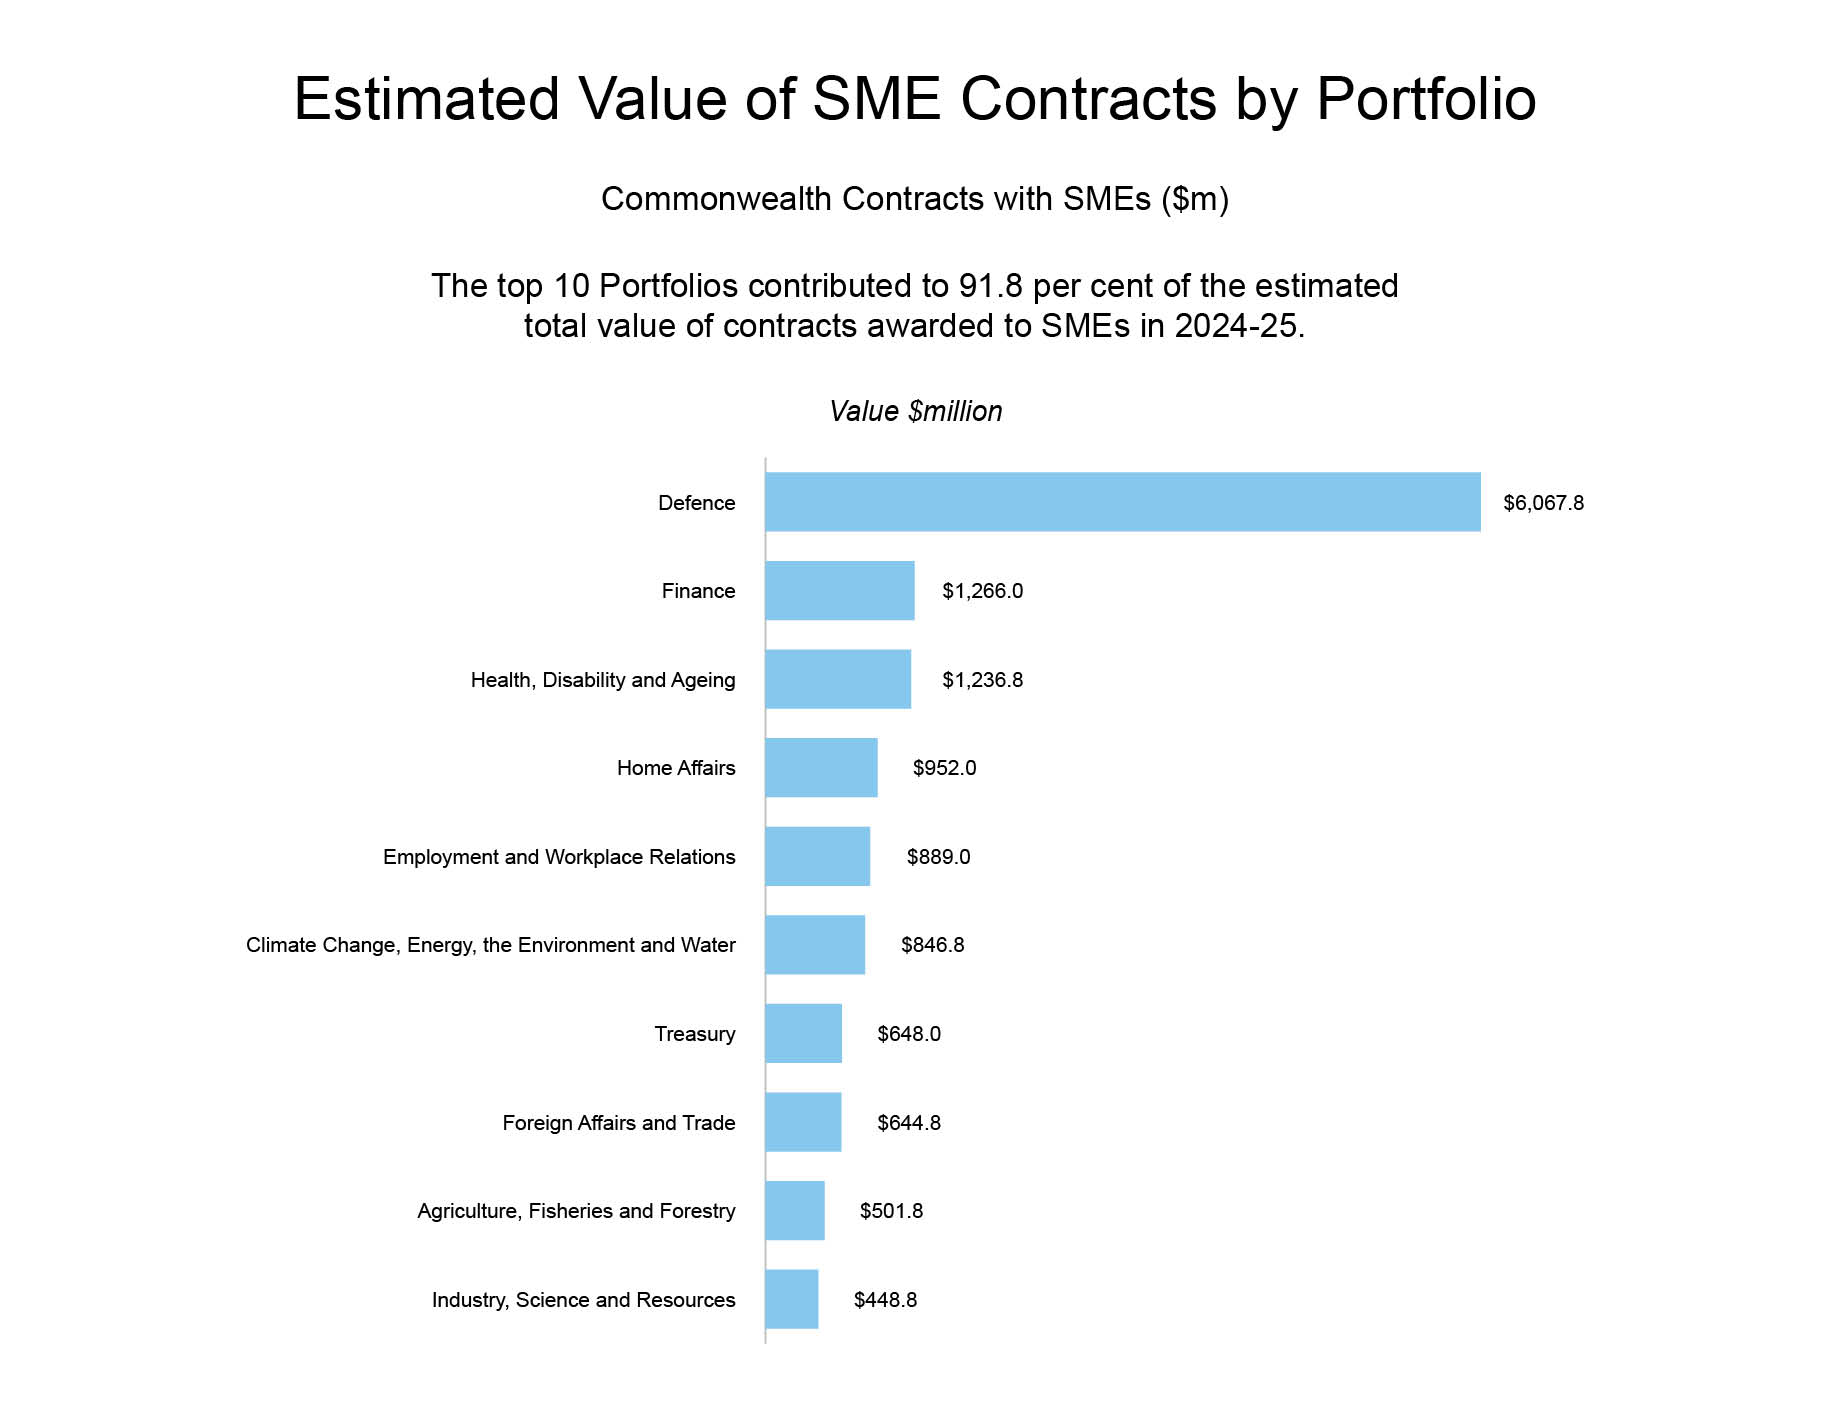
*Note - these figures reflect Portfolio structures as at 1 July 2025 (for instance, Services Australia data is included in the Finance portfolio).
SME participation by threshold
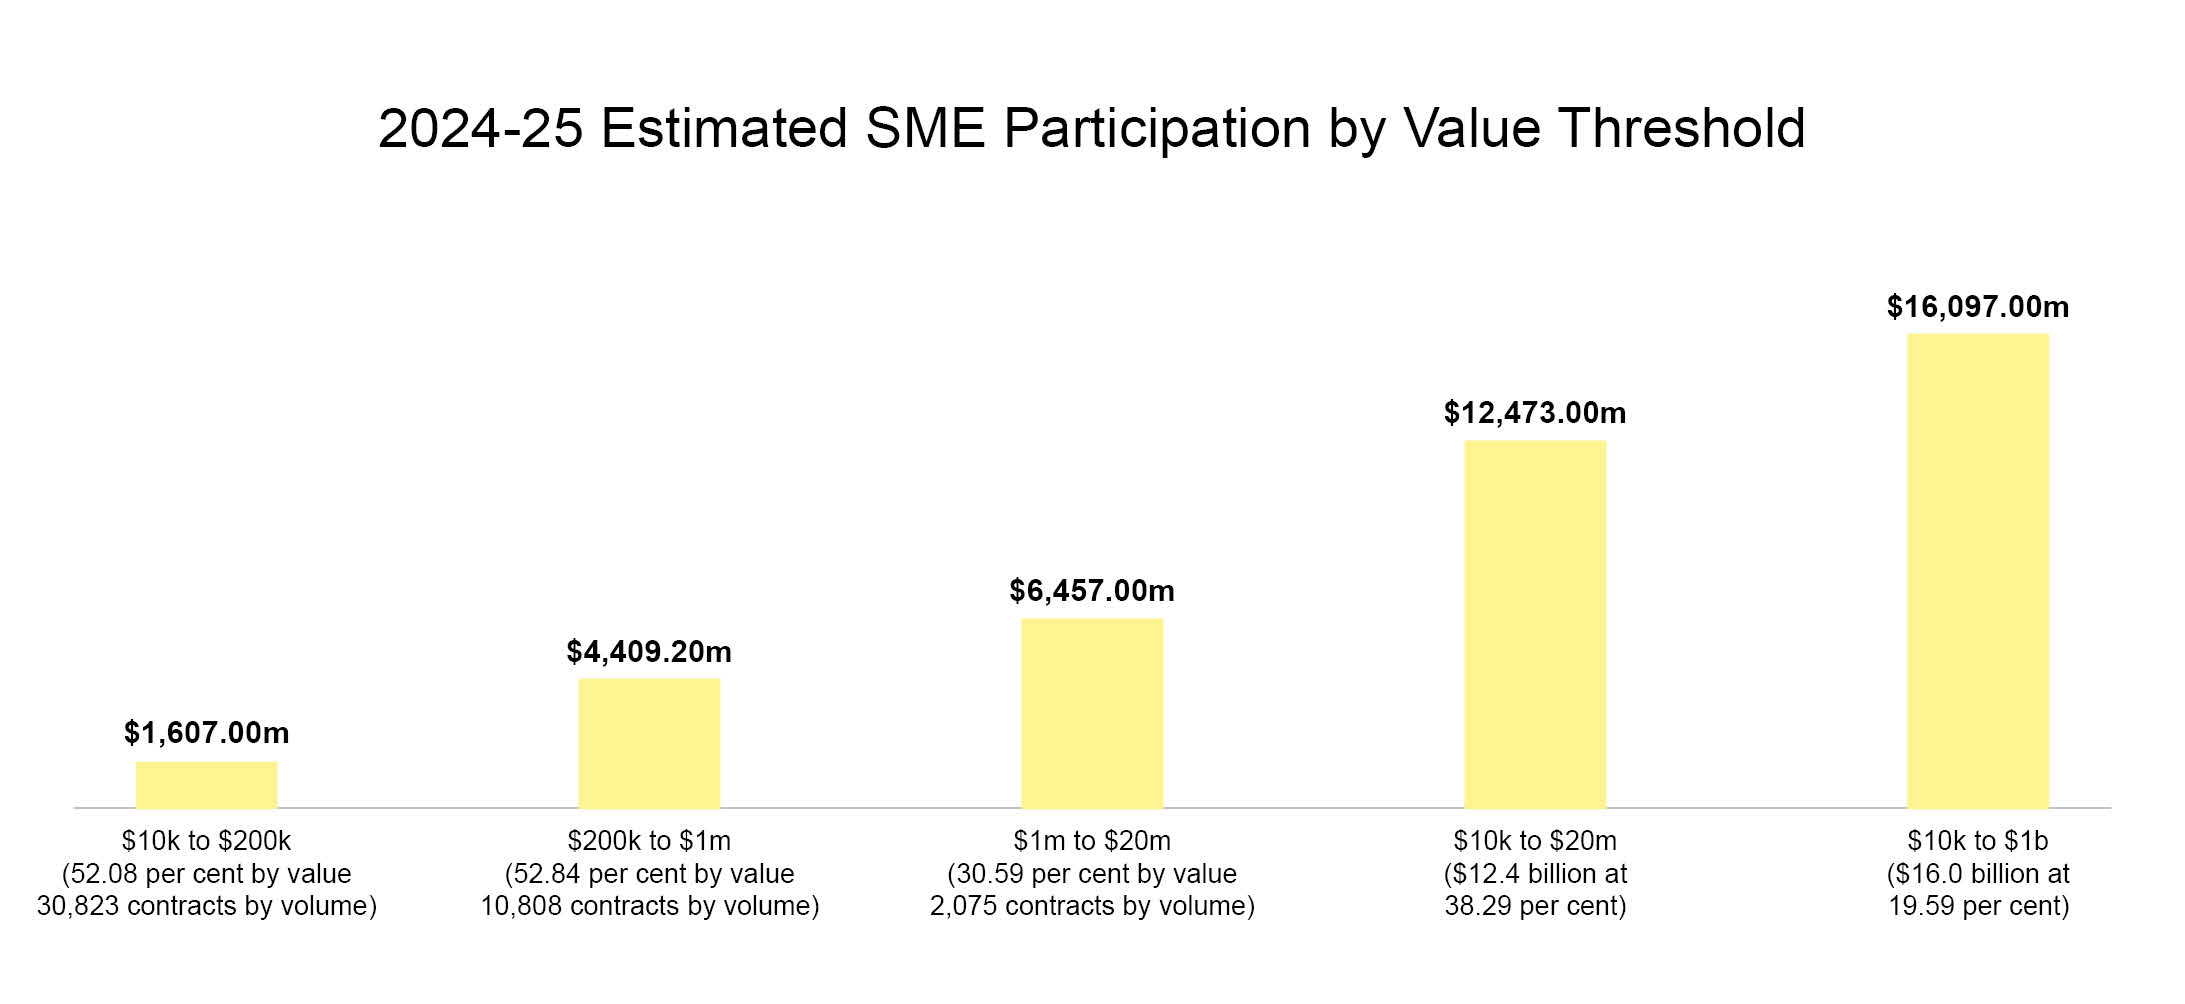
*Note - statistics exclude values under $10,000 due to ABS confidentiality limitations.
| SME | Small Business | Total | ||||
|---|---|---|---|---|---|---|
| Financial Year | Value $million | Number of Contracts | Value $million | Number of Contracts | Value $million | Number of Contracts |
| 2024-25 | 14,703.0 | 45,556 | 5,915.8 | 26,975 | 104,899.8 | 86,926 |
| 2023-24 | 18,745.3 | 43,642 | 8,166.0 | 23,312 | 99,641.1 | 83,453 |
| 2022-23 | 20,461.9 | 44,146 | 7,976.8 | 23,309 | 74,824.4 | 83,625 |
| 2021-22 | 24,914.8 | 50,921 | 8,536.7 | 26,352 | 80,793.4 | 92,303 |
| 2020-21 | 18,657.1 | 45,773 | 5,473.0 | 23,020 | 69,794.5 | 84,054 |
| 2019-20 | 13,601.0 | 41,880 | 5,362.8 | 21,256 | 53,975.4 | 81,174 |
| 2018-19 | 16,668.1 | 41,341 | 6,316.5 | 20,842 | 64,454.6 | 78,150 |
| 2017-18 | 12,911.6 | 38,739 | 4,017.0 | 21,135 | 71,127.3 | 73,458 |
